Posts

Showing posts from October, 2009

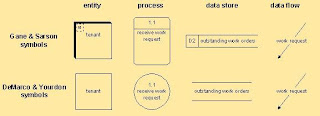
Symbol Used In Data Flow Diagram (DFD)
Image
Entities: can be people, departments, other companies, other systems… are called sources if they are external to the system and provide data to the system, and sinks if they are external to the system and receive information from the system Processes must have at least one input and at least one output at the primitive level (see below) are labeled with verb + object (e.g. “print invoice” or “add customer”) (e.g. in the hierarchy below, none of the processes are primitive) at the non-primitive level, are labeled more generally (e.g. “customer maintenance” or “warehouse reports”) Data stores: · can be online or “hard copy” (see notes on logical VS physical DFD’s below) · are labeled with a noun (e.g. the label “customer” indicates that information about customers is kept in that data store) · data is stored whenever there are more than one process that needs it and these processes don’t always...

What is DFD ? or What is Data Flow Diagram?

A data-flow diagram ( DFD ) is a graphical representation of the "flow" of data through an information system. DFDs can also be used for the visualization of data processing ( structured design ). On a DFD , data items flow from an external data source or an internal data store to an internal data store or an external data sink, via an internal process . A DFD provides no information about the timing or ordering of processes, or about whether processes will operate in sequence or in parallel. It is therefore quite different from a flowchart, which shows the flow of control through an algorithm, allowing a reader to determine what operations will be performed, in what order, and under what circumstances, but not what kinds of data will be input to and output from the system, nor where the data will come from and go to, nor where the data will be stored (all of which are shown on a DFD ). ...