Posts

Food Ordering System

Image
Food Ordering System 0 (Zero) level DFD context diagram for online food ordering system level 0 dfd for food ordering system er diagram for online food ordering system data flow diagram example for online shopping data flow diagram level 0 1 2 examples data flow diagram symbols level 2 dfd for online food ordering system data flow diagram for pizza ordering system

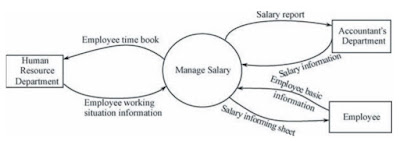
Context Level DFD for Salary Management System

Image
Context Level DFD  Salary Management System

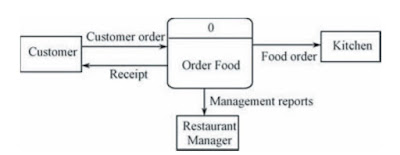
Food Ordering System Context Level DFD

Image
Food Ordering System Context Level DFD

DFD for Internet Sales System

Image
DFD - Data Flow Diagram Internet Sales System data flow diagram for online ordering system data flow diagram for online shopping system data flow diagram for online shopping pdf data flow diagram tutorial data flow diagram symbols data flow diagram for online cake shop data flow diagram for catering system

Find Common Mistakes in DFD

Image
Learn How to Find  Common Mistakes in Data Flow Diagram (DFD) ? data flow diagram symbols data flow diagram practice problems identify three typical syntax errors commonly found in dfds data flow diagram symbols pdf context level data flow diagram benefits of data flow diagram data flow diagram tutorial types of data flow diagram

How to Draw Context Level DFD

Image
dfd level 0 types of data flow diagram data flow diagram symbols context diagram context diagram example with explanation data flow diagram tutorial pdf data flow diagram symbols and rules 0 level dfd

Context Level DFD Medical Store Management

Image
Context Level Data Flow Diagram (DFD) for  Medical Store Management There three main External Entities: 1) Store keeper 2) Medical Representative [ MR ] 3) Customer Prepared by : Students of MCA Batch 2014-16 Department of MCA B H Gardi College, Rajkot

School Management System - Context Level DFD

Image
Context Level DFD for  School Management System Prepared by : Students of  Batch 2012-15 Department of MCA B H Gardi College, Rajkot

BUS Ticket Reservation System - Context Level DFD

Image
Context Level DFD for  BUS Ticket Reservation System Prepared by : Students of  Batch 2012-15 Department of MCA B H Gardi College, Rajkot

Business Production Management - Context Level DFD

Image
Context Level DFD for  Business Production Management Prepared by : Students of  Batch 2012-15 Department of MCA B H Gardi College, Rajkot

Online Examination System - Context Level DFD

Image
Context Level DFD for  Online Examination System Prepared by : Students of  Batch 2009-12 Department of MCA B H Gardi College, Rajkot

Hostel Management System - Context Level DFD

Image
Context Level DFD for  Hostel Management System Prepared by : Students of  Batch 2009-12 Department of MCA B H Gardi College, Rajkot

Medical Store Management System - Context Level DFD

Image
Context Level DFD for Medical Store Management System Prepared by : Students of  Batch 2009-12 Department of MCA B H Gardi College, Rajkot

School Management System - Context Level DFD

Image
Context Level DFD for  School Management System Prepared by : Students of  Batch 2009-12 Department of MCA B H Gardi College, Rajkot

Difference between Uses and Extends

  Difference between Uses and Extends Probably the best way to think about these diagram elements is as follows:- "X uses Y" indicates that the task "X" has a subtask "Y"; that is, in the process of completing task "X", task "Y" will be completed at least once. "X extends Y" indicates that "X" is a task for the same type as "Y", but "X" is a special, more specific case of doing "Y". That is, doing X is a lot like doing Y, but X has a few extra processes to it that go above and beyond the things that must be done in order to complete Y.

Uses and Extend Arrows in Use Case Diagram

Uses Arrow: The uses arrow (or uses edge as it would be called in traditional graph theory) is drawn from a use case X to another use case Y to indicate that the process of doing X always involves doing Y at least once (although it may involve doing it many times, "at least once" is the only relationship guaranteed by this symbol.) This symbol can be referred to as an aggregation operator, because it indicates that a given use case is an aggregate (made up of parts) whose components are the use cases that it uses. If a certain use case uses several others, that means that all of the component use cases must be completed in the process of completing the aggregate use case, although there is no specification in Use Case Diagrams of the order in which these are completed. A brief, mnemonic way to think about the uses arrow is that it can be read X uses Y means that "X has a Y" as part of it's behaviour.   Extends Arrow: The extends arrow (or extends...

How to Find Actors for Use Case Diagram

 How to Find Actors for Use Case Diagram? When working from an Action/Response table, identifying the actors is easy: entities whose behaviour appears in the "Actor's Actions" column are the actors, and entities whose behaviour appears in the "System's Response" column are components in the system. If you are working from an informal narrative, a sequence diagram, or a scenario description, the actors are typically those entities whose behaviour cannot control or change (i.e., agents that are not part of the system that you are building or describing.) The most obvious candidates for actors are the humans in the system. Except in rare cases when the system you are describing is actually a human process, such as a specific method of dealing with customers that employees should follow, the humans that you must interact with will all be actors. If your system interacts with other systems (databases, servers maintained by other people, legacy sy...

Use Case Diagram

Introduction to Use Case Diagram UML Use Case Diagrams can be used to describe the functionality of a system in a horizontal way. That is, rather than merely representing the details of individual features of your system, Use Case Diagrams can be used to show all of its available functionality. It is important to note, though, that Use Case Diagrams are fundamentally different from sequence diagrams or flow charts because they do not make any attempt to represent the order or number of times that the systems actions and sub-actions should be executed. There are a number of graphical examples in this FAQ; you might want to look over them to familiarise yourself with the look of them. Use Case Diagrams have only 4 major elements: ·          the actors that the system you are describing interacts with ·          the system itself ·          the use case...

UML Diagram

The Unified Modeling Language (UML) is a general-purpose visual modeling language that is used to specify, visualize, construct, and document the artifacts of a software system. It captures decisions and understanding about systems that must be constructed. It is used to understand, design, browse, configure, maintain, and control information about such systems. It is intended for use with all development methods, life cycle stages, application domains, and media. The modeling language is intended to unify past experience about modeling techniques and to incorporate current software best practices into a standard approach. UML includes semantic concepts, notation, and guidelines. It has static, dynamic, environmental, and organizational parts. It is intended to be supported by interactive visual modeling tools that have code generators and report writers. The UML specification does not define a standard process but is intended to ...

Purpose of DFD

The purpose of Data Flow Diagrams is to show the “flow” and transformation of data through the system.  These diagrams are used as a visualization tool to help the audience get a better idea of what exactly is going on in the system.     A Context Diagram is shown next, which is the general overview of each of the different agents interacting with the system.    The Level 0 Diagram shows some more details about which processes each of the agents will be interacting with.  Arrows are drawn to show the flow of data between the agents and processes.    Following the Level 0 Diagram are Level 1, Level 2, Level 3 and Level 4 Diagrams.  These Diagrams further break down each of the processes that are involved with the system, each showing more detail the further down the level is.