Purpose of DFD
The purpose of Data Flow Diagrams is to show the “flow” and transformation of data through the system. These diagrams are used as a visualization tool to help the audience get a better idea of what exactly is going on in the system.
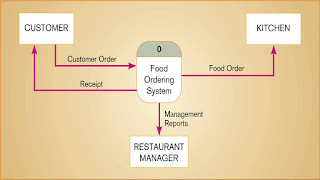
A Context Diagram is shown next, which is the general overview of each of the different agents interacting with the system.
The Level 0 Diagram shows some more details about which processes each of the agents will be interacting with. Arrows are drawn to show the flow of data between the agents and processes.
Following the Level 0 Diagram are Level 1, Level 2, Level 3 and Level 4 Diagrams. These Diagrams further break down each of the processes that are involved with the system, each showing more detail the further down the level is.

Comments
Post a Comment