Overview of DFD
A Data Flow Diagram (DFD) is a graphical representation of the "flow" of data through an information system. DFDs can also be used for the visualization of data processing.
On a DFD, data items flow from an external data source or an internal data store to an internal data store or an external data sink, via an internal process.
A DFD provides no information about the timing of processes, or about whether processes will operate in sequence or in parallel. It is therefore quite different from a flowchart, which shows the flow of control through an algorithm, allowing a reader to determine what operations will be performed, in what order, and under what circumstances, but not what kinds of data will be input to and output from the system, nor where the data will come from and go to, nor where the data will be stored (all of which are shown on a DFD).
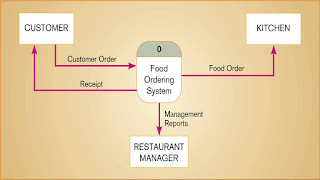
It is common practice to draw the context-level data flow diagram first, which shows the interaction between the system and external agents which act as data sources and data sinks. On the context diagram the system's interactions with the outside world are modeled purely in terms of data flows across the system boundary. The context diagram shows the entire system as a single process, and gives no clues as to its internal organization.
This context-level DFD is next "exploded", to produce a Level 0 DFD that shows some of the detail of the system being modeled. The Level 0 DFD shows how the system is divided into sub-systems (processes), each of which deals with one or more of the data flows to or from an external agent, and which together provide all of the functionality of the system as a whole. It also identifies internal data stores that must be present in order for the system to do its job, and shows the flow of data between the various parts of the system.

Comments
Post a Comment